MySQL Read write segregation brings a great amount of benefits to our applications in terms of performance and stress resistance. These includes:
- The capability of query process increase as the number of physical machines increase;
- The reader and writer response for read and write respectively greatly alleviates exclusive lock and share lock contention;
- We can independently improve and optimize the read, e.g. using myiasm engine setting with specific optimization parameters;
- Synchronization via binlog;
- Improve availability.
AWS Aurora has made read write segregation really simple.
In the following section, I will explain how to write a SpringBoot application to work with Aurora reader and writer. We will first create the Aurora cluster then writing an annotation to enable classes or methods to use reader or writer as data source.
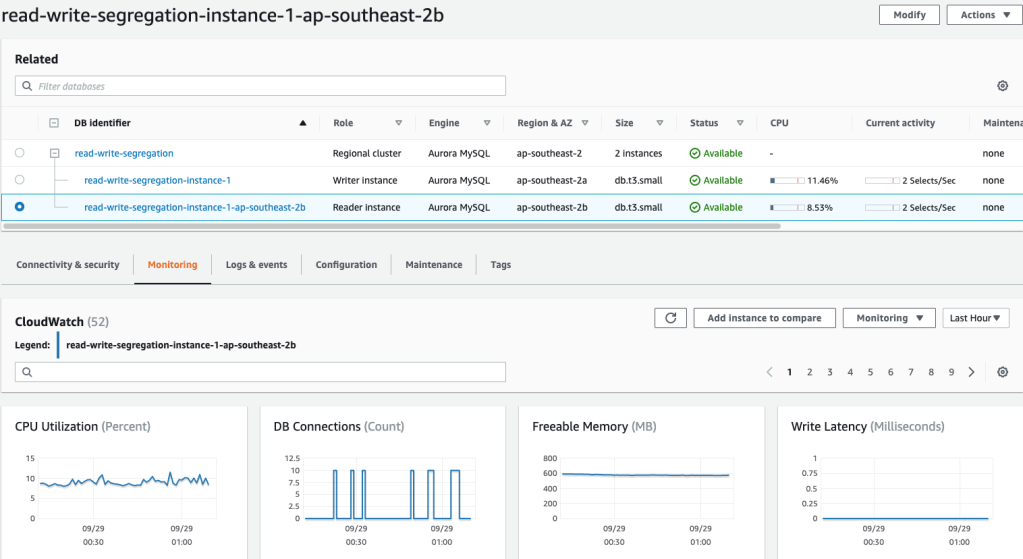
Step 1: create an Aurora cluster with reader and writer
Step 2: The Spring Boot application configuration
spring:
  datasource:
    reader:
      username: admin
      password: [your_password]
      driver-class-name: com.mysql.cj.jdbc.Driver
      jdbc-url: jdbc:mysql://your_reader_url:3306/commentdb?serverTimezone=UTC&useUnicode=true@characterEncoding=utf-8
      pattern: get*,find*
    writer:
      username: admin
      password: [your_password]
      driver-class-name: com.mysql.cj.jdbc.Driver
      jdbc-url: jdbc:mysql://your_writer_url:3306/commentdb?serverTimezone=UTC&useUnicode=true@characterEncoding=utf-8
      pattern: add*,update*
  jpa:
    hibernate:
      ddl-auto: update

server:
  port: 8080
Step 3: The Dynamic Data Source
We will extends the AbstractRoutingDataSource class to write our dynamic data source
public class DynamicDataSource extends AbstractRoutingDataSource {
    public DynamicDataSource(DataSource defaultTargetDataSource, Map<Object, Object> targetDataSources) {
        super.setDefaultTargetDataSource(defaultTargetDataSource);
        super.setTargetDataSources(targetDataSources);
        super.afterPropertiesSet();
    }

    @Override
    protected Object determineCurrentLookupKey() {
        return DynamicDataSourceContextHolder.getDataSourceType();
    }
}
We will have a DynamicDataSourceContextHolder class internally using ThreadLocal to ensure
every thread has its own data source context which won’t be changed by other threads.
public class DynamicDataSourceContextHolder {
    /**
     * Use ThreadLocal to make sure every thread has its own data source context
     * which won't be changed by other threads
     */
    private static final ThreadLocal<String> CONTEXT_HOLDER = new ThreadLocal<>();

    public static void setDataSourceType(String dataSourceType){
        CONTEXT_HOLDER.set(dataSourceType);
    }

    public static String getDataSourceType(){
        return CONTEXT_HOLDER.get();
    }

    public static void clearDataSourceType(){
        CONTEXT_HOLDER.remove();
    }
}
Step 4: The DataSource annotation
We will have a DataSource annotation, which can annotate both classes and methods.
Here’s how it works:
- If a class is annotated with @DataSource, all its methods matches the regex rules we specify in our application.properties will switch to their related datasource.
- If both a method and its class are annotated with @DataSource, only the method annotation will take effect.
The DataSourceType enum
public enum DataSourceType {
    READER,
    WRITER
}
The DataSource Annotation
@Target({ ElementType.METHOD, ElementType.TYPE})
@Retention(RetentionPolicy.RUNTIME)
@Documented
public @interface DataSource {
    DataSourceType value() default DataSourceType.WRITER;
}
The DataSourceAspect
@Aspect
@Order(1)
@Component
public class DataSourceAspect {
    private final Pattern READ_PATTERN;
    private final Pattern WRITER_PATTERN; // by default we use writer

    public DataSourceAspect(@Value("${spring.datasource.reader.pattern}") String readPattern,
                            @Value("${spring.datasource.writer.pattern}") String writerPattern) {
        READ_PATTERN = Pattern.compile(getRegex(readPattern));
        WRITER_PATTERN = Pattern.compile(getRegex(writerPattern));
    }

    private String getRegex(String str) {
        return str.replaceAll("\\*", ".*")
                                 .replaceAll(" ", "")
                                 .replaceAll(",", "|");
    }

    @Around("within(@com.osfocus.springbootreadwritesegregation.annotation.DataSource *)")
    public Object around(ProceedingJoinPoint point) throws Throwable {
        MethodSignature signature = (MethodSignature) point.getSignature();
        point.getTarget();
        Method method = signature.getMethod();
        DataSource dataSource = method.getAnnotation(DataSource.class);
        if (dataSource != null) {
            // In order to have higher granularity,
            // I make method level annotation has higher priority than the class level.
            DynamicDataSourceContextHolder.setDataSourceType(dataSource.value().name());
        } else {
            if (READ_PATTERN.matcher(method.getName()).matches()) {
                DynamicDataSourceContextHolder.setDataSourceType(DataSourceType.READER.name());
            } else {
                DynamicDataSourceContextHolder.setDataSourceType(DataSourceType.WRITER.name());
            }
        }

        try {
            return point.proceed();
        } finally {
            // clear data source after method's execution.
            DynamicDataSourceContextHolder.clearDataSourceType();
        }
    }
}
We will have Comment related Controller, Service and Repository to simulate requests to read, update and write comments to social media platforms.
We annotate the CommentServiceImpl service
@Service
@DataSource
public class CommentServiceImpl implements CommentService {
    @Autowired
    private CommentRepository commentRepository;

    public List<Comment> findTop25() {
        return commentRepository.findTop25ByOrderByIdDesc();
    }

    public void addComment(CommentDTO commentDTO) {
        commentRepository.save(Comment.builder()
                                      .content(commentDTO.getContent())
                                      .build());
    }

    public void updateLastComment(CommentDTO commentDTO) {
        Optional<Comment> lastCommentOpt = commentRepository.findTopByOrderByIdDesc();
        if (lastCommentOpt.isPresent()) {
            commentRepository.updateLastComment(lastCommentOpt.get().getId(), commentDTO.getContent());
        }
    }
}
Last Step: The JMeter test
Without Read/Write segregation
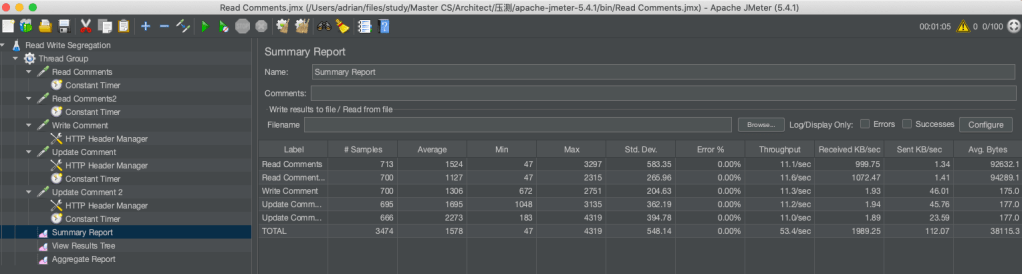
With Read/Write Segregation enable

As we can see from the above two screenshots of the simple experiment, there’s improvement on the throughput.
In the experiment, the db instances are still way below its upper capability and they used the default parameter groups. As an extra machine involved, its capability of handling queries is certain to have dramatically improvement. Also, we can play around with the parameter group to make its performance better.
Here’s the code: https://github.com/adrianinthecloud/spring-aurora-read-write-segregation
Have fun.